AHA's deforestation risk assessment is an independent, county-level evaluation of the risk that forest in a given U.S. county has been converted to agricultural land. It is designed to support importers and exporters in demonstrating due diligence under the EU Deforestation Regulation (EUDR).
The assessment draws on the USDA National Agricultural Statistics Service (NASS) Cropland Data Layer (CDL) — an annual, geo-referenced, crop-specific land cover dataset produced from satellite imagery and extensive agricultural ground reference data — alongside forest cover data and expert review. For each county, the assessment establishes the percentage of forest area with a deciduous component that has potentially been converted to agricultural land.
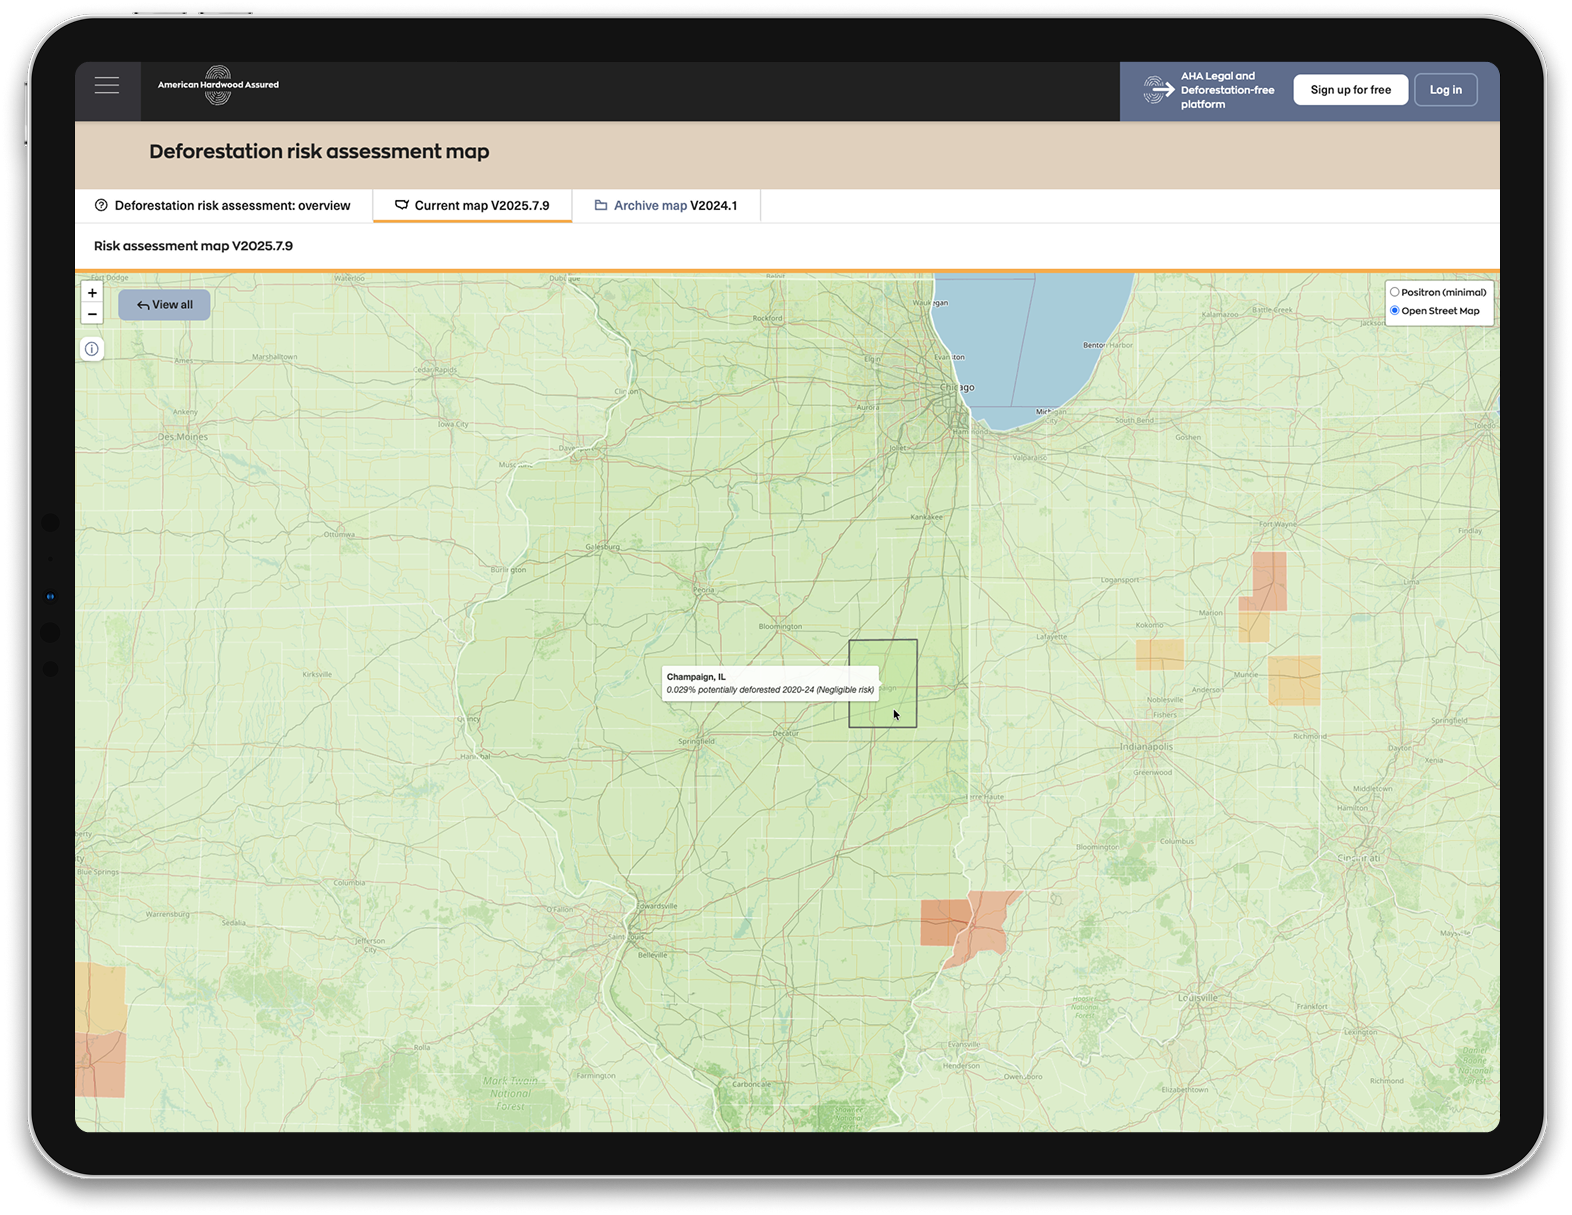
For each U.S. county across 37 states, the AHA assessment currently identifies the percentage of hardwood forest area potentially converted to agricultural land between 2020 and 2025 and classifies counties as follows:
Versions of the assessment
The assessment is updated periodically, and each version is named after the year of the CDL data it is derived from. All versions are published and hosted here, so the basis for any given assessment remains permanently available. Each version is accompanied by a description of the data sources and methodology specific to that release, as the underlying datasets and analysis evolve over time.
How this links to AHA statements
Every AHA statement is linked to the version of the assessment that was current at the time of shipment. When you receive a statement as an importer, you can click on any of the counties identified as a source for that shipment and view its risk classification on the online map, exactly as it stood for the relevant version. This ensures that the risk information attached to a statement always reflects the assessment in force when the shipment was made, rather than any later revision.
For more detailed information on deforestation risk, view our annual risk assessment report.
Learn more about the innovative work going on behind the scenes.
How this assessment was prepared
This version of the analysis starts from the JRC Global Map of Forest Cover 2020 (v3). USDA Cropland Data Layers (CDL) from 2017–2020 are then used to remove softwood forests leaving a base map of deciduous forest and mixed forest. This base map is compared against the 2025 10m-resolution CDL to locate potential areas of deforestation. The results are then refined using several further data sources — primarily historic CDL data — to identify areas that are unlikely to have been forest in the recent past and which therefore cannot be deemed to have contributed to deforestation under the EUDR.
Within the counties originally assessed as carrying a higher than 0.1% per annum risk of deforestation (62 counties), the 308 sites most likely to affect the outcome — those that confirm whether tree loss does or does not constitute deforestation — were analysed using the Expert Eye tool. This analysis reduced the number of counties carrying risk from 62 to 37.
For each U.S. county, the assessment shows the percentage of total forest area with a deciduous component potentially converted to agricultural land since 2020. Counties are classified as follows:
How this assessment was prepared
Using the latest developments in artificial intelligence, combined with the USDA’s Cropland Data Layer (geo-referenced, crop-specific data produced using satellite imagery), AHA’s unique map provides in-depth deforestation risk data at county level.
For each U.S. county across 37 states, the AHA assessment identifies the percentage of hardwood forest area potentially converted to agricultural land between 2020 and 2024 and classifies counties as follows: